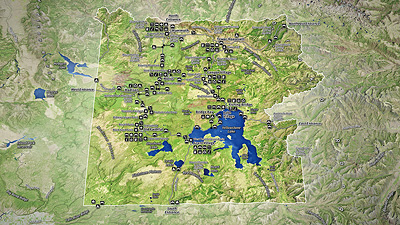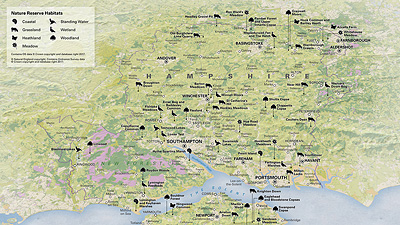


A section of the map graphic.

The key to the map shown in more detail.
World Population Distribution
This display contains graphs and a thematic map. The main focus of the map was to highlight the variations in population density across the world. The series of 'spherical graphs' highlight the relative populations of each of the continents over time.
The main graphic on show here uses a three-dimensional approach to map the world's population by density. Utilising the third dimension in this way gives the viewer an immediate impression as to the distribution of the world's population.
The spherical graphs, positioned at the bottom of the page, are sized proportionately to one another in relation to the world's population at three different intervals. The graphs are then subdivided to show the percentage of the total population found in each continent.
Data from the following organisation was used in the compilation of the map on these pages: Center for International Earth Science Information Network.